Ask your survey data a question. Get the dashboard and the stat tables.
Explora is built for market-research institutes. Chat on the left, dashboard on the right, and the dashboard builds itself while you talk. The statistical tables are exported as CSV and XLSX. Built on top of the Strategoi Vertex engine.
The rule
The AI never writes a number.
Every number in a table, chart, animation or chat comment comes from the Strategoi Vertex engine. A number the AI did not read from a table is rewritten before it reaches the reader.
The engine
Why the numbers hold
Industry-standard syntax
Vertex was built to run the industry-standard Quantum tabulation syntax: axes, tables, weights, bases and significance tests. Existing tabulation programs and expertise carry over.
Cell by cell identical
Results identical to the reference tabulation outputs: 99.999% of cells (2,249,883 of 2,249,916 across nine reference runs; the 33 differences are significance letters).
Nothing hidden
The program is always visible and editable in Vertex Studio: axes, run and results. Nothing is hidden behind the AI.
Export and traceability
Every stat table exports to CSV and XLSX with bases, percentages and significance letters, and carries the engine version and a data fingerprint.
How it works
From a question to a dashboard in four steps
Reads
The AI reads the dataset and the files you drop in chat: questionnaires, analysis plans, old tables and charts.
Writes the program
It writes the Vertex program, always visible and editable by anyone who can read it.
Computes
Vertex computes the tables, already prepared for every filter option.
Dashboard ready
KPIs, charts, tables and the comment in chat, all in one place.
In the product
Real screens, synthetic data
The interface below is the working product, on synthetic data.
Start from a question
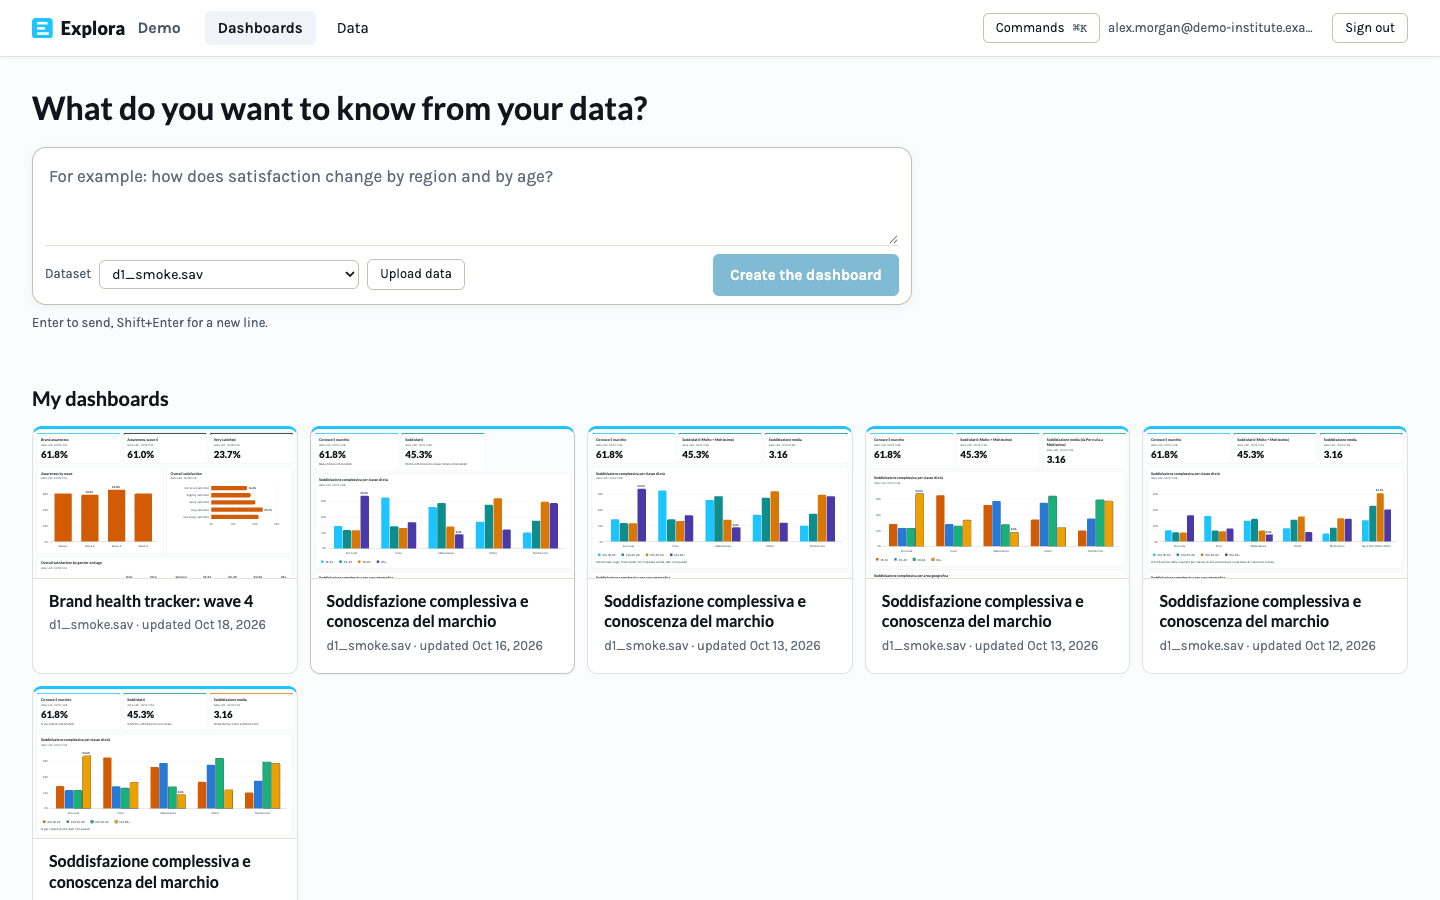
Type what you want to know about your data, load a dataset or pick one, and Explora creates the dashboard.
A dashboard you can filter
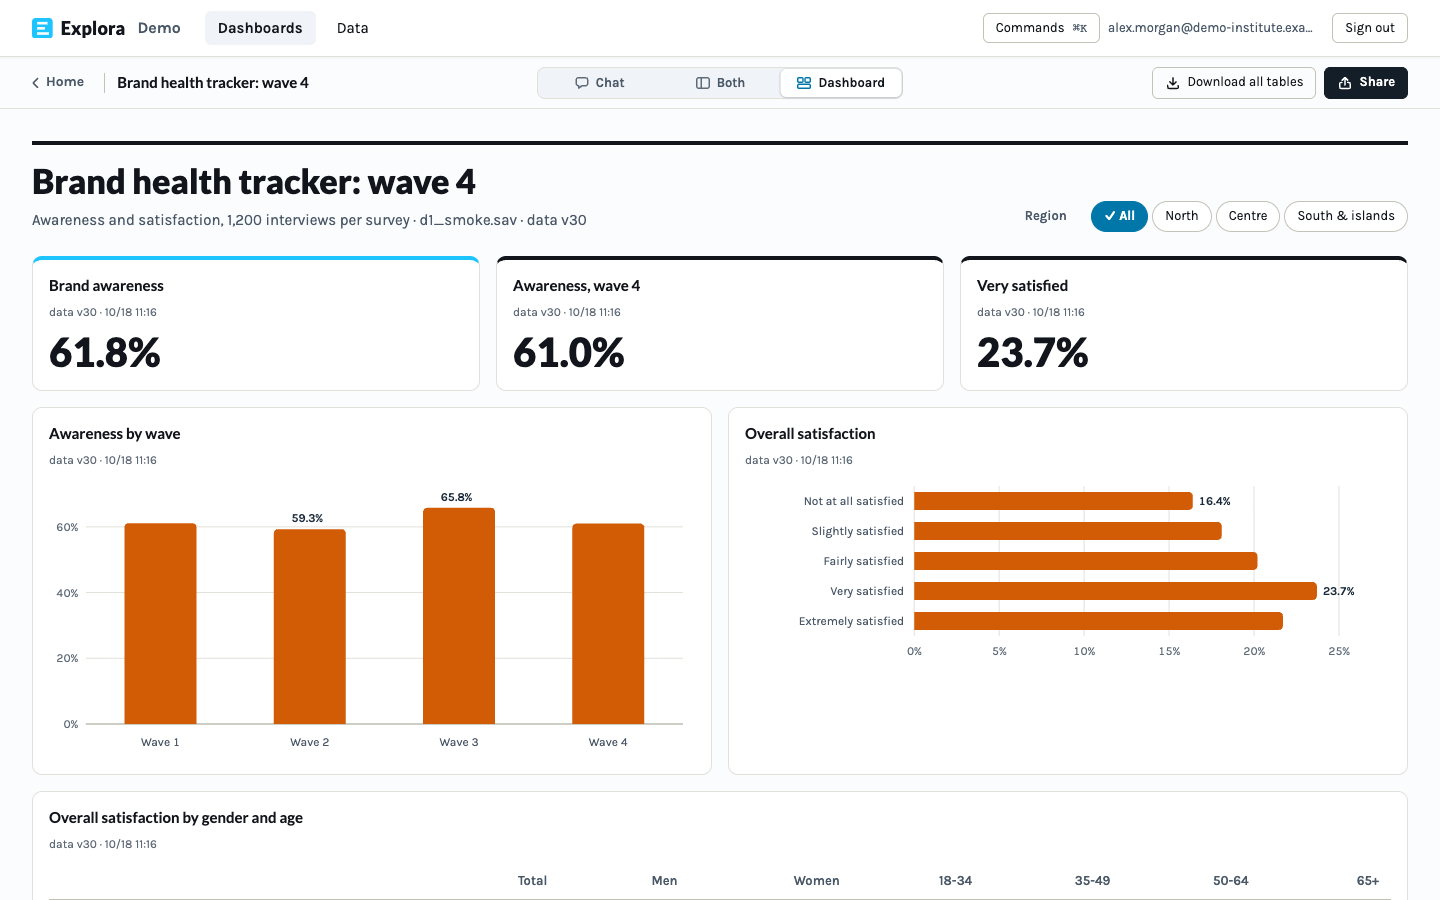
KPIs, charts and tables, with filters that switch instantly because the tables are already computed.
Refine in chat
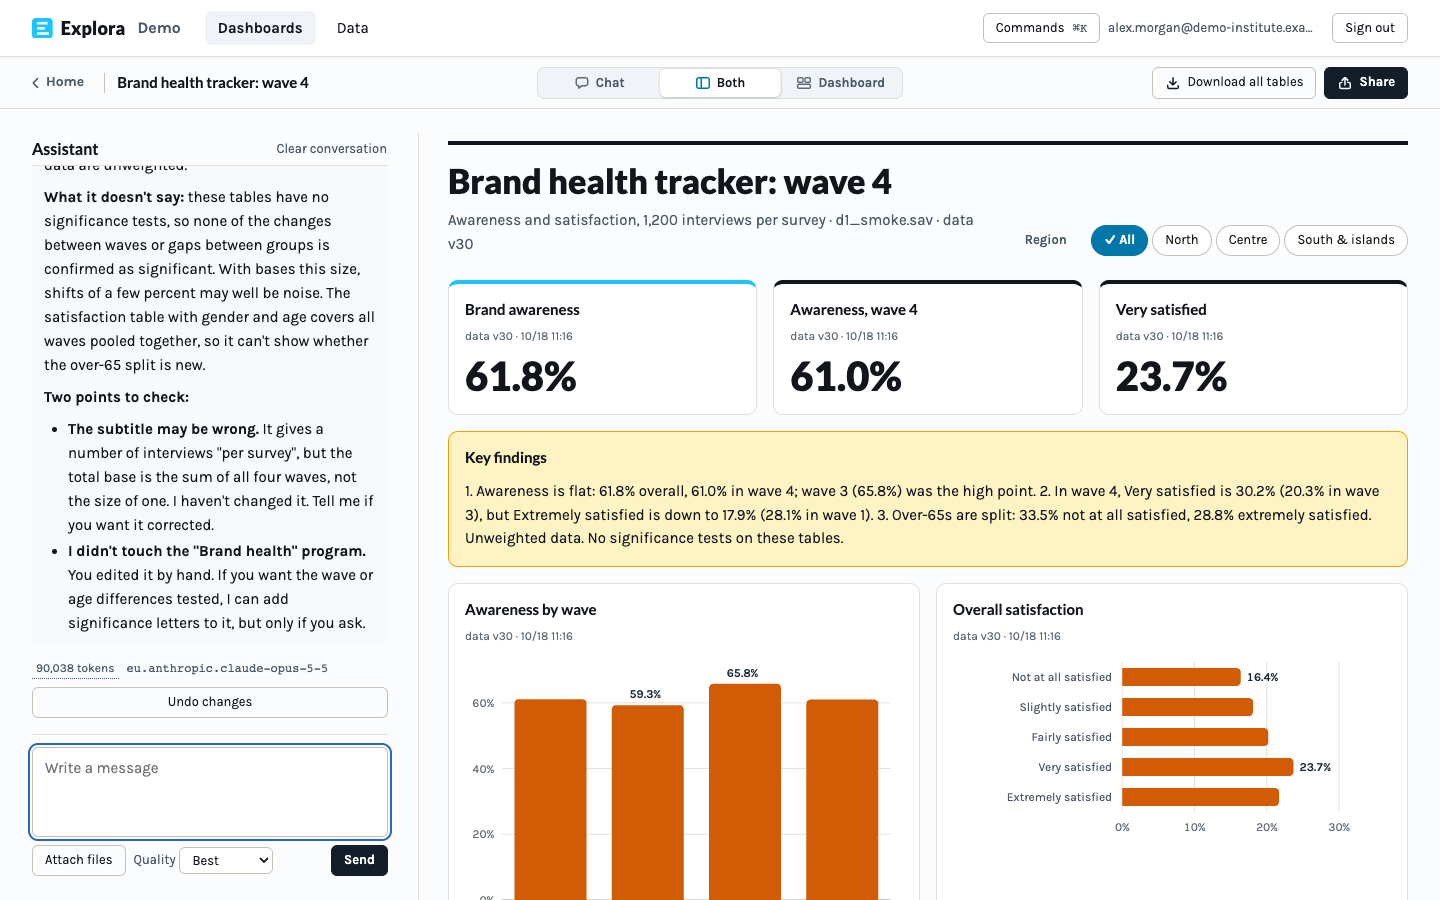
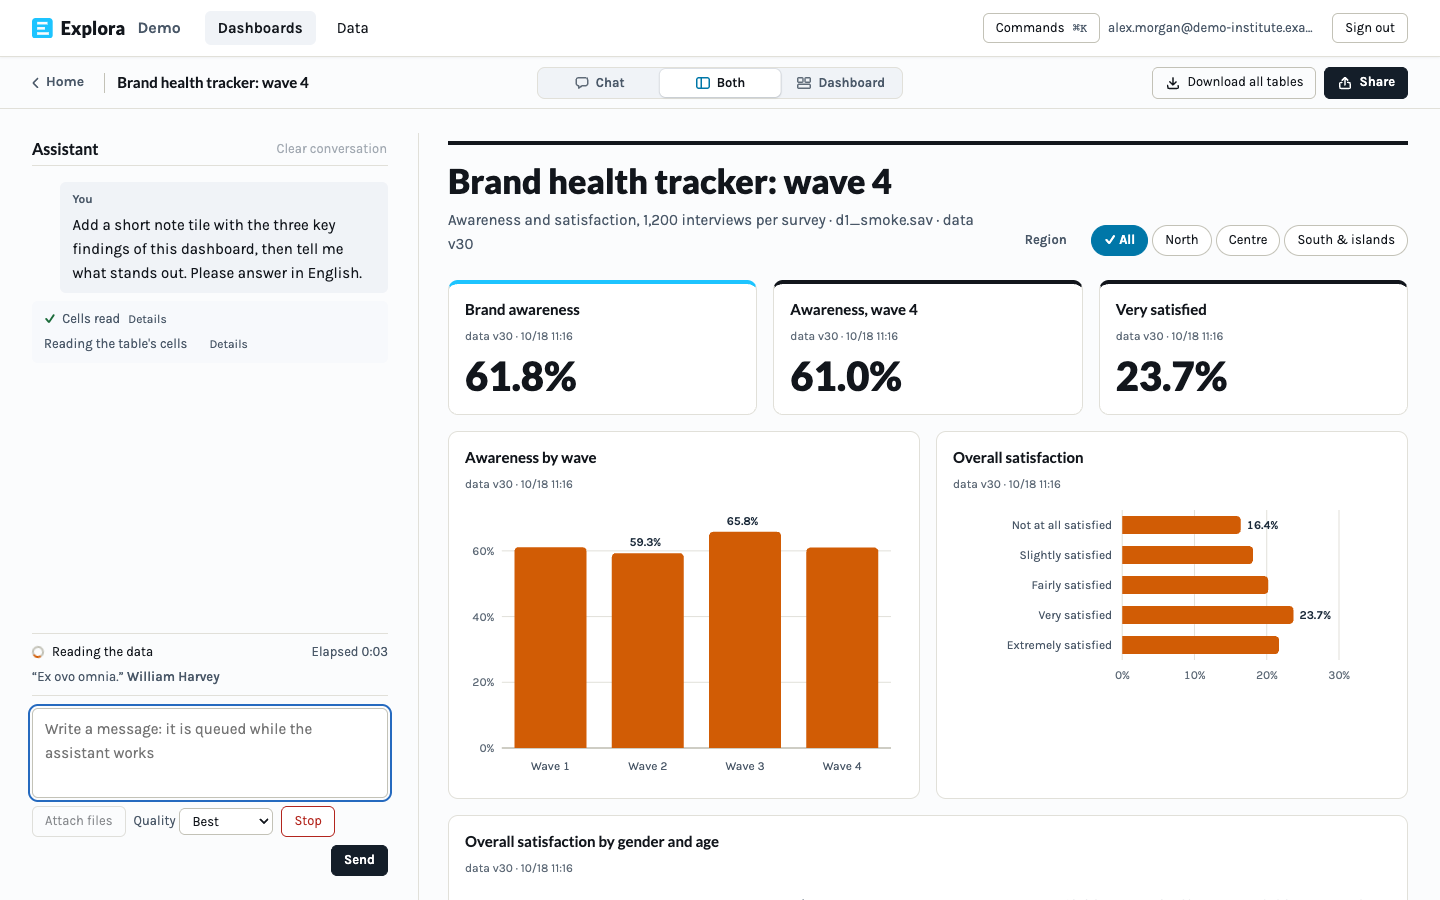
Ask for a change and the dashboard updates while the assistant works. Nothing to approve.
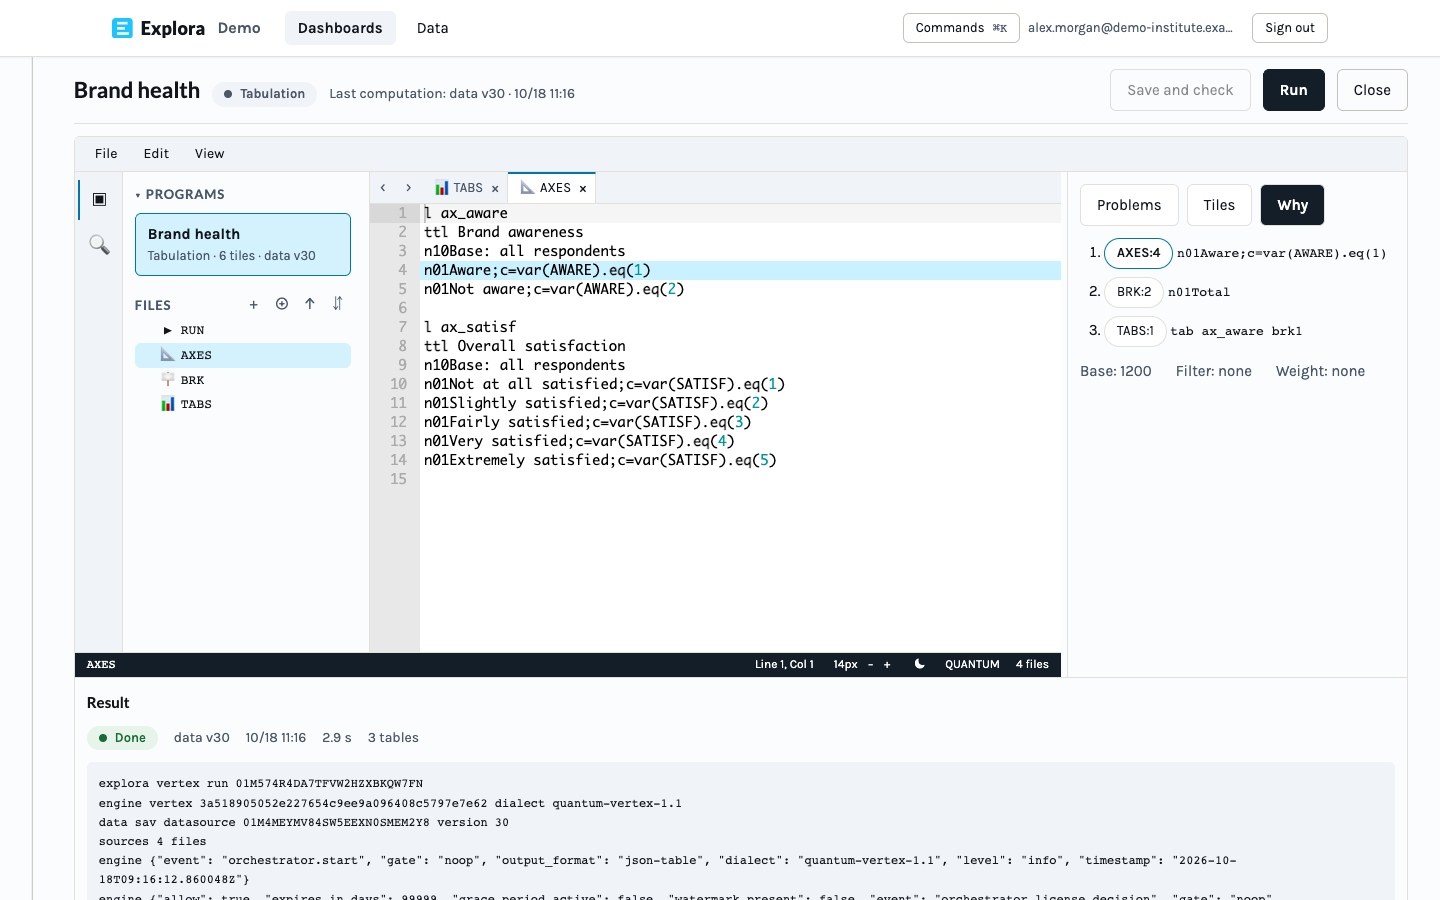
Vertex Studio
For people who know tabulation: axes, tables, weights, run and results sit beside the program. Read it, edit it, run it again.
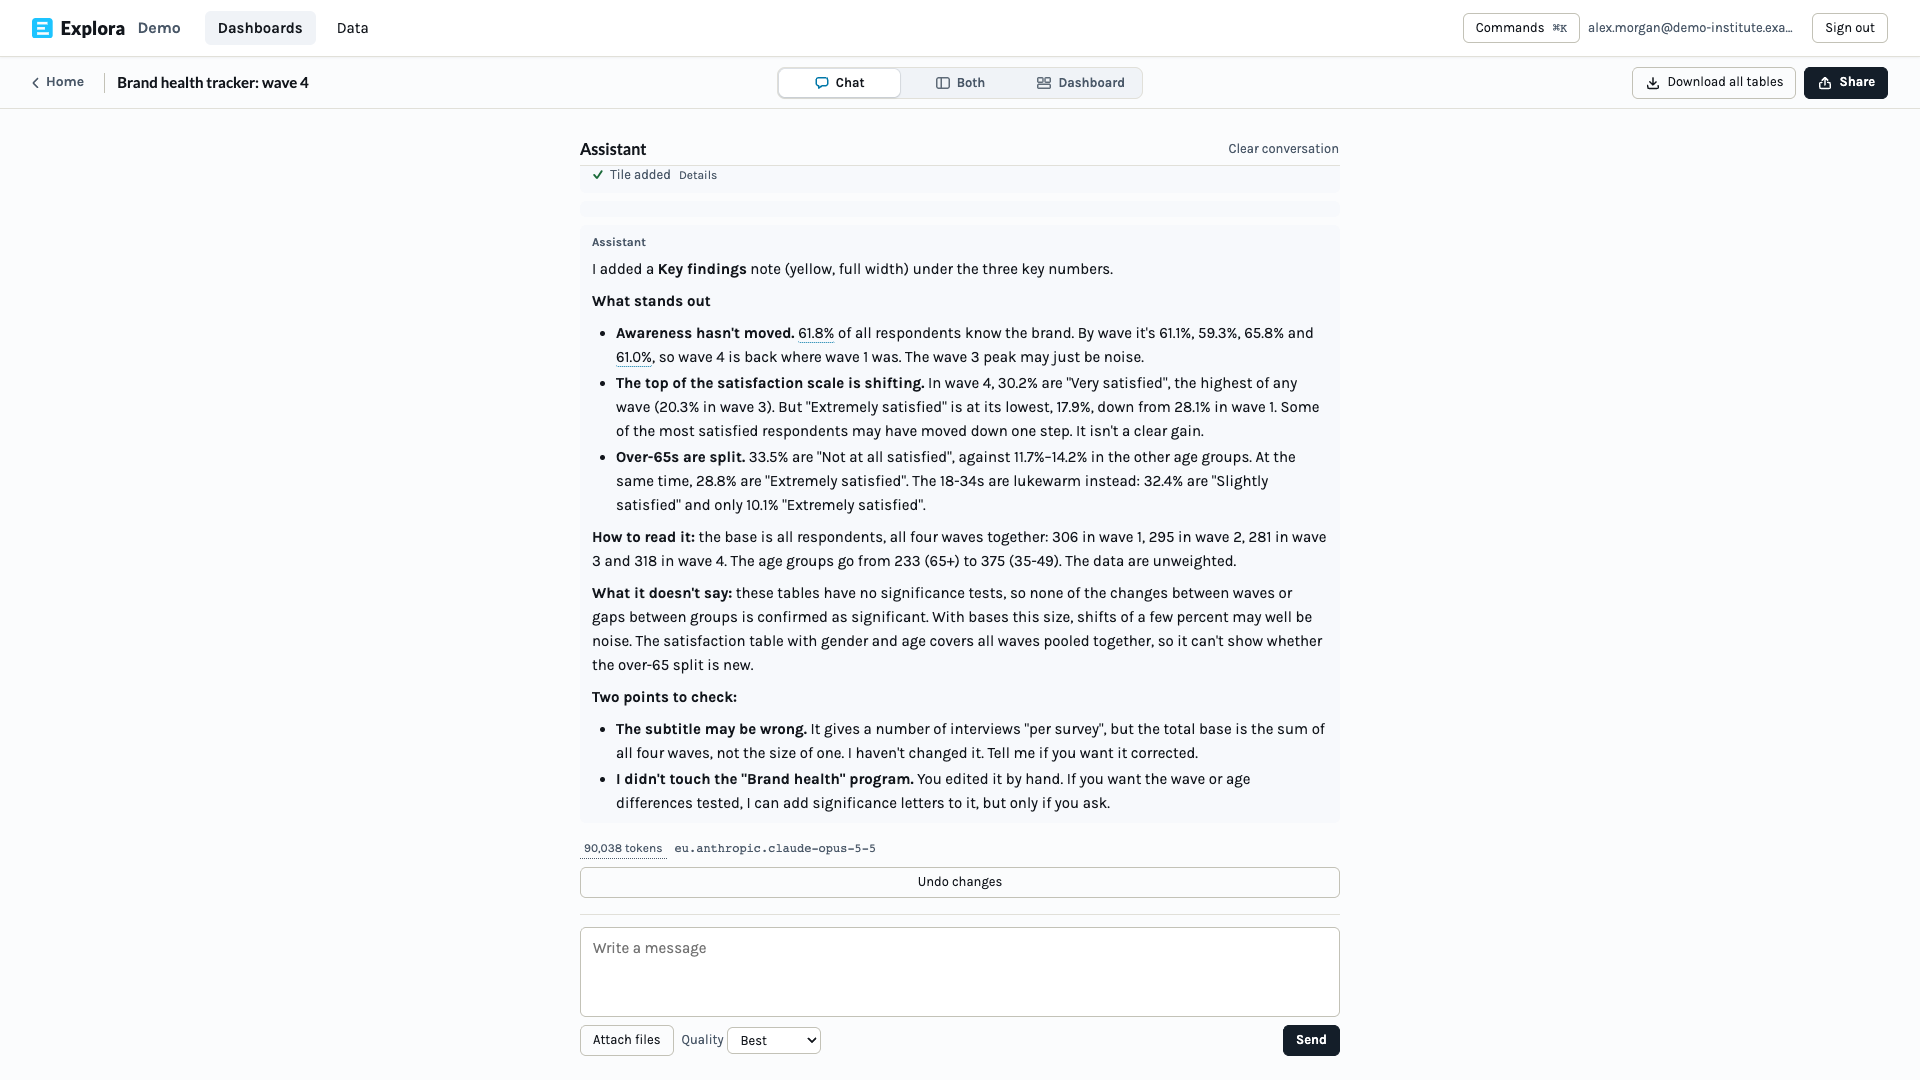
Comments you can trust
The assistant summarises findings in chat, and every figure it quotes was read from a Vertex table.
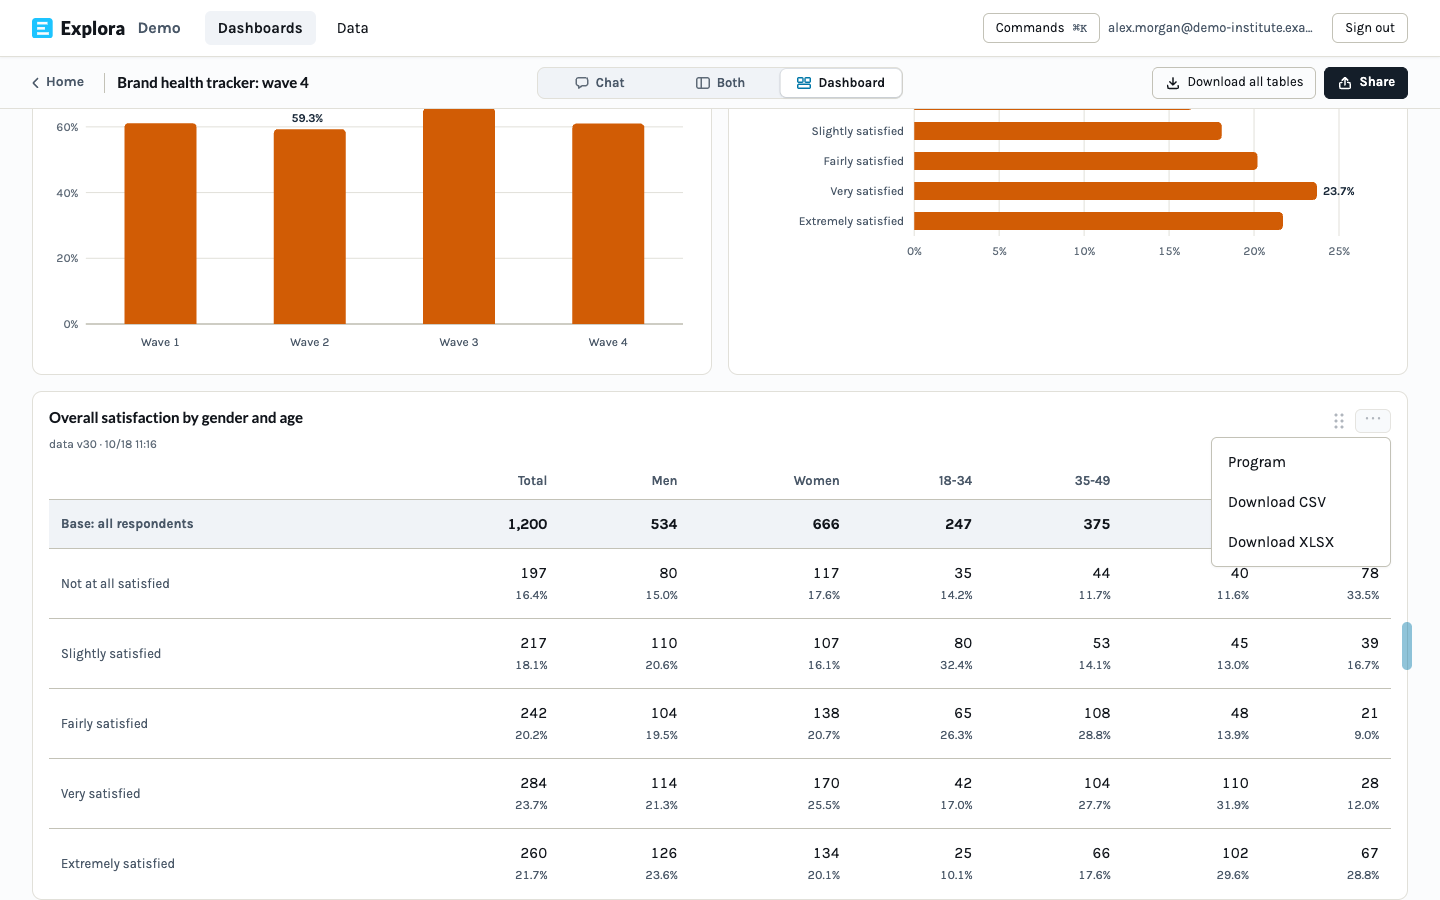
Export the stat tables
Download all the tables of a dashboard as CSV or XLSX, with bases, percentages and significance letters.
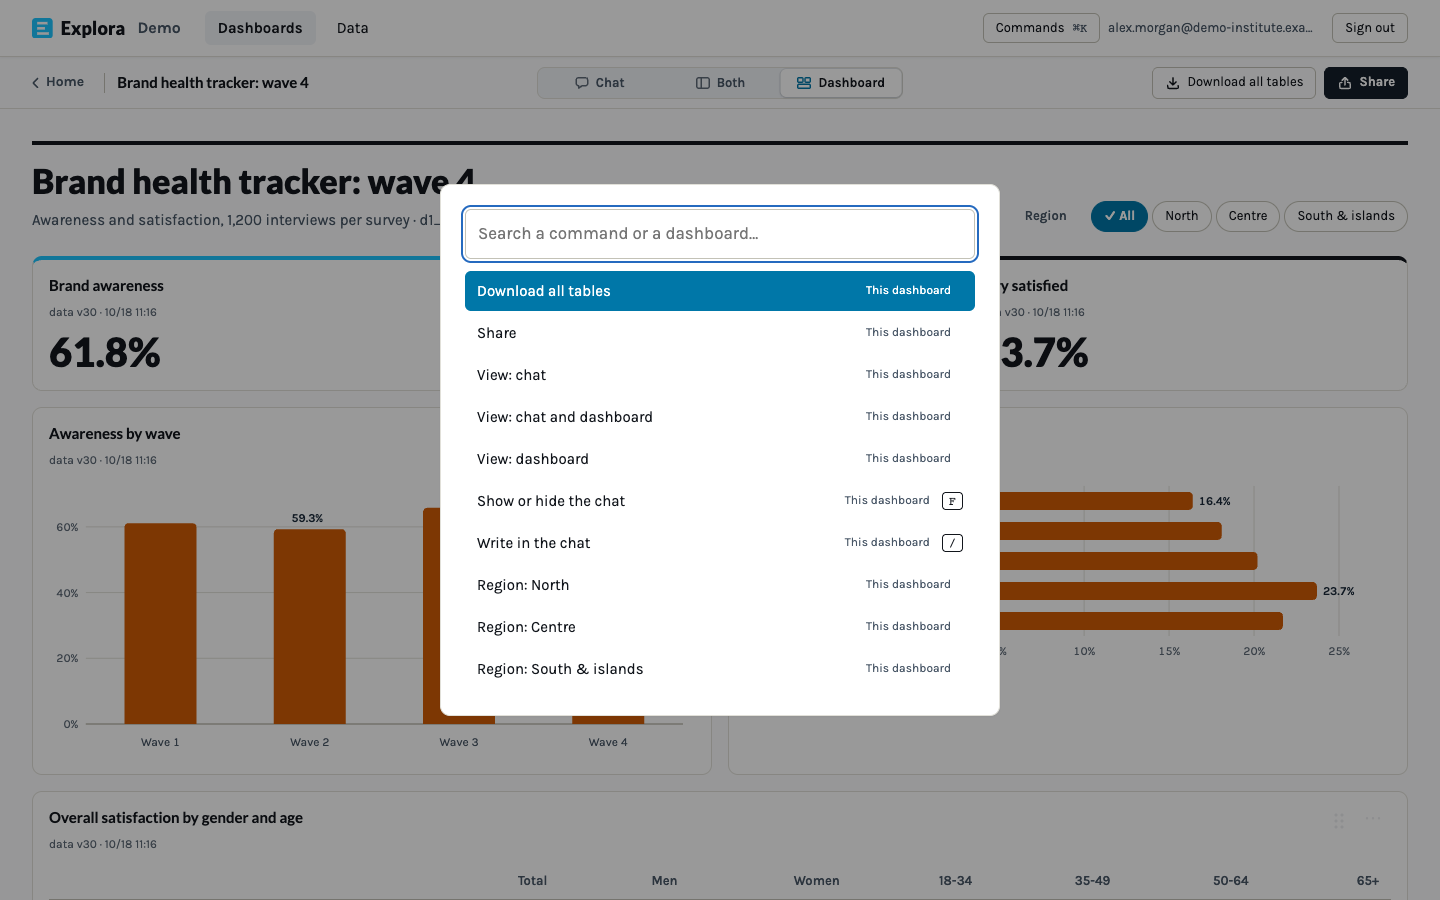
Command palette
Download all tables, share, set filters or start a new dashboard from the keyboard.
Platform
Four pillars
Data
SPSS, CSV, Excel, Parquet and fixed-width survey files, or a read-only link to PostgreSQL, SQL Server or MySQL.
Tables
The Strategoi Vertex engine: crosstabs, weights, bases, significance letters and statistics.
Dashboards
KPIs, charts, tables, notes, MP4 animations and filters, with CSV and XLSX download.
Sharing
Private, whole workarea, or a read-only link. Readers ask the AI on their own copy.
Roles
Built for the whole institute
Editor
- Loads data or links a database
- Builds dashboards with the AI
- Reads and edits Vertex programs
- Shares
Viewer
- Opens shared dashboards
- Asks the AI on their copy
- Downloads CSV and XLSX
- Sees only Vertex-computed numbers
Administrator
- Users and roles
- AI spending caps
- Public links on or off
- Institute databases
Security
Your data stays yours
Isolated workarea
One workarea per institute, with its own users, storage and encryption key.
MFA and roles
Multi-factor sign-in with an authenticator app, and separate roles.
AWS Milan
Data, computation and dashboards run on AWS in Milan (eu-south-1).
AI in the EU
Claude on Amazon Bedrock with an EU inference profile. Requests stay in the EU and nothing is trained on your data.
Read-only databases
Credentials live in AWS Secrets Manager, never visible to the AI or in logs.
Caps and traceability
AI spending caps per role and person. Every table carries the engine version and a data fingerprint.
Try it on your data
A demo on one of your studies: we load the data, ask the AI for a dashboard, and compare the tables with yours cell by cell.
Request information